
Earth System Science
Climate Change and Adaptation Finance
Work in Progress
The Long-run Impact of Climate Shocks on the Cost of Capital
How will tropical cyclones and temperature shocks make it harder for countries to attain financing for climate change?
Quantifying the Role of Adaptive Capacities in Moderating Climate Damages
How can we account for countries’ differential adaptive capacities in climate damage functions?

Academic Publications
Choi, J., Diffenbaugh, N. S., & Burke, M. (2024). The Effect of Flood Exposure on Insurance Adoption Among US Households. Earth’s Future, 12(7), e2023EF004110. https://doi.org/10.1029/2023EF004110
Disaster-scale floods are expected to become more frequent in a warming climate, impacting areas where insurance is not mandated. Many flood-exposed properties are currently uninsured, potentially undermining the climate resilience of communities. We investigate whether households might adapt to the changing flood risk by purchasing and maintaining insurance over time. We find that while disaster-scale floods increase insurance demand, this effect is temporary, even among counties experiencing consecutive disaster-scale flood years. This effect is more salient among inland counties as well as among homeowners whose primary residence is exposed to a disaster-scale flood. We conclude that relying on households to self-adapt by maintaining insurance is insufficient for closing the insurance protection gap.

Publications with Climate Policy Initiative
-

Financial Innovation for Climate Adaptation in Africa
Current adaptation finance flows to Africa are insufficient to meet growing adaptation needs on the continent. This report provides an overview of existing adaptation finance flows in Africa and identifies opportunities to increase the volume and efficacy of that finance.
-
Framework for Sustainable Finance Integrity
The financial system lies at the heart of a sustainable future, particularly in the wake of the COVID-19 pandemic. Financial actors, including governments, central banks and financial supervisors, development finance institutions, commercial banks, asset owners, asset managers, and insurers, must work together to create a financial ecosystem that accurately prices risk and rewards sustainability, thus supporting the move towards a sustainable, net zero future.
-
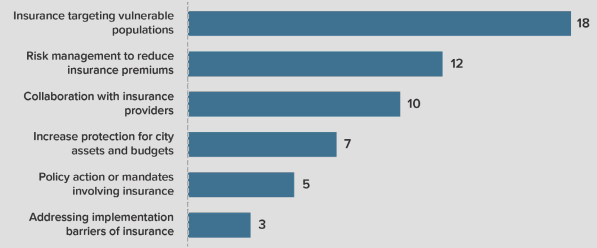
Building Climate Resilience in Cities through Insurance
Cities can play a key role in closing the global protection gap by acting as insurance consumers and funding risk reduction, as stewards of risk reduction and management through policy and planning, and as promoters of knowledge about risk and insurance provision within the urban ecosystem. Insurance plays a crucial role in transferring and mitigating risk, but the benefits of climate-risk insurance for cities go beyond increasing financial and fiscal resilience to climate-related risks.
-

Adaptation Finance in the Context of Covid-19
Climate shocks are happening now—compounding risks and impacts alongside the fallout from the Covid-19 pandemic, especially for the most vulnerable. Building resilience to climate impacts will be critical to the efficacy of response and recovery efforts, yet climate-adaptation finance flows are at risk of falling sharply in the coming years at a moment when adaptation finance has never been more important.
-

IDFC Green Finance Mapping 2020
The International Development Finance Club (IDFC) is the leading group of 26 national and regional development banks from all over the world, the majority of which are active in emerging markets. During the 2019 UN Climate Action Summit, IDFC affirmed a series of commitments to improve the quality of climate finance beyond increasing volume, including efforts to further align financial flows with the Paris Agreement and Sustainable Development Goals.
-

Implementing Alignment with the Paris Agreement: Recommendations for the IDFC
Members of the IDFC, 24 national, bilateral, and regional development finance institutions with more than USD 4 trillion in assets under management, can play a critical role in supporting the economic transformation of their countries of operation towards Paris alignment. Their close relationship with national and sub-national governments allow members to provide direct input and feedback on policy design and influence project pipelines.
Green Finance in China
-

Green Bonds in China: the State and Effectiveness of the Market / 中国绿色债券市场:趋势与分析
The rapid growth of the Chinese green bond market demonstrates impressive ambition and demand for green financing in China. This report accounts for USD 120 billion cumulative green bond issuance in China, which amounts to a reduction of more than a 52.6 million tons of CO2e and at least 11.2 GW of installed clean energy capacity.
-

Green Banking in China – Emerging Trends / 中国绿色银行业—新兴趋势
The impact of China’s banking system goes beyond China’s borders. Together the Big Four contributed USD 240 billion to the fossil fuel industry from 2016 to 2019. 44% of this contribution, or USD 106 billion, went towards coal mining and coal power, making the Big Four the top four financiers of coal globally.
-

The Potential for Scaling Climate Finance in China
China’s climate action in the coming decade will play a decisive role in whether the world can limit global warming to 1.5 degrees Celsius. As the world’s largest source of CO2 emissions, China accounts for nearly a third of the global total. Based on its current trajectory, China’s emissions are expected to increase further by 7%-15% by 2030 above 2015 levels, which would more than offset the global decreasing trend.